
Trump’s price has fallen more than 27% in the past 24 hours, with his market cap now at $7.5 billion, down from about $15 billion just two days ago. This sharp decline comes amid high volatility, as the currency is trading within a consolidation range between the $30.3 support and the $45 resistance.
While technical indicators such as the RSI and ADX indicate neutral momentum and no clear trend, the probability of a major breakout or breakdown remains high. If Trump regains his uptrend, he could target an 88% rally to $71.8, but missing key support at $30.3 could trigger a sharp correction towards $15.43.
Trump’s RSI is currently neutral
Trump’s RSI currently stands at 46.8, up sharply from 30 just yesterday, indicating a quick recovery from oversold conditions, after reaching 67 a few hours ago.
A move towards the 50 level suggests that momentum is neutral, but the token’s stance still indicates caution as it remains below the threshold of a clear uptrend.
The Relative Strength Index (RSI) is a technical indicator used to measure the speed and magnitude of price movements to assess market momentum. It ranges from 0 to 100, with values above 70 indicating overbought conditions, often preceding a price correction, and values below 30 indicating oversold conditions, which can indicate a potential recovery.
At 46.8, Trump’s RSI reflects a neutral phase, indicating the possibility of price stability or gradual growth. However, the symbol needs to break above the 50 level to indicate stronger upward momentum and boost confidence in a sustainable uptrend.
TRUMP ADX shows an indefinite trend
The TRUMP ADX currently stands at 14.4, down significantly from 46 just yesterday. This sharp decline indicates a significant weakness in trend strength, as the currency is moving sideways without a clear directional bias.
A low ADX level indicates that Trump is experiencing low volatility and indecisive market behavior in the short term.
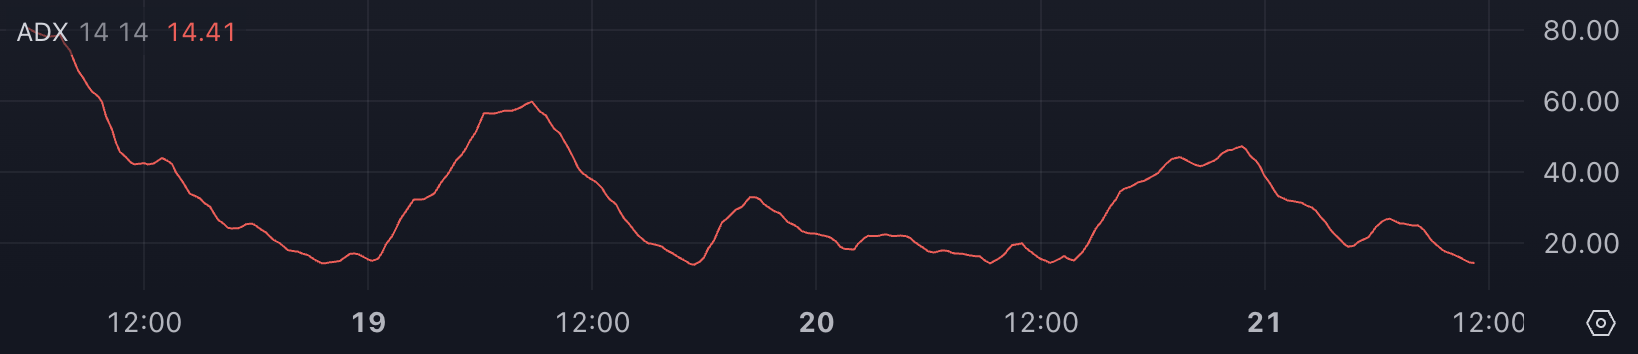
The Average Directional Index (ADX) measures the strength of a trend, regardless of its direction, on a scale from 0 to 100. Readings above 25 usually indicate a strong trend, while values below 20 indicate a weak or non-existent trend. With TRUMP ADX at 14.4, the token’s price action is currently directionless, reflecting a consolidation phase.
This sideways action can precede a breakout as momentum rebuilds or extend further if traders remain hesitant to commit to a specific trend.
Trump Price Prediction: Will Trump Correct Further by 59%?
Trump is currently trading in a range defined by resistance at $45 and support at $30.30, reflecting a period of consolidation. If the symbol regains its uptrend and positive momentum, it may test the $45 resistance level.
A break above this level could open the door to a rally to $64.50, and further strength could push Trump to $71.80, representing a potential upside of 88% from current levels and making it one of the top 3 meme coins in the market.
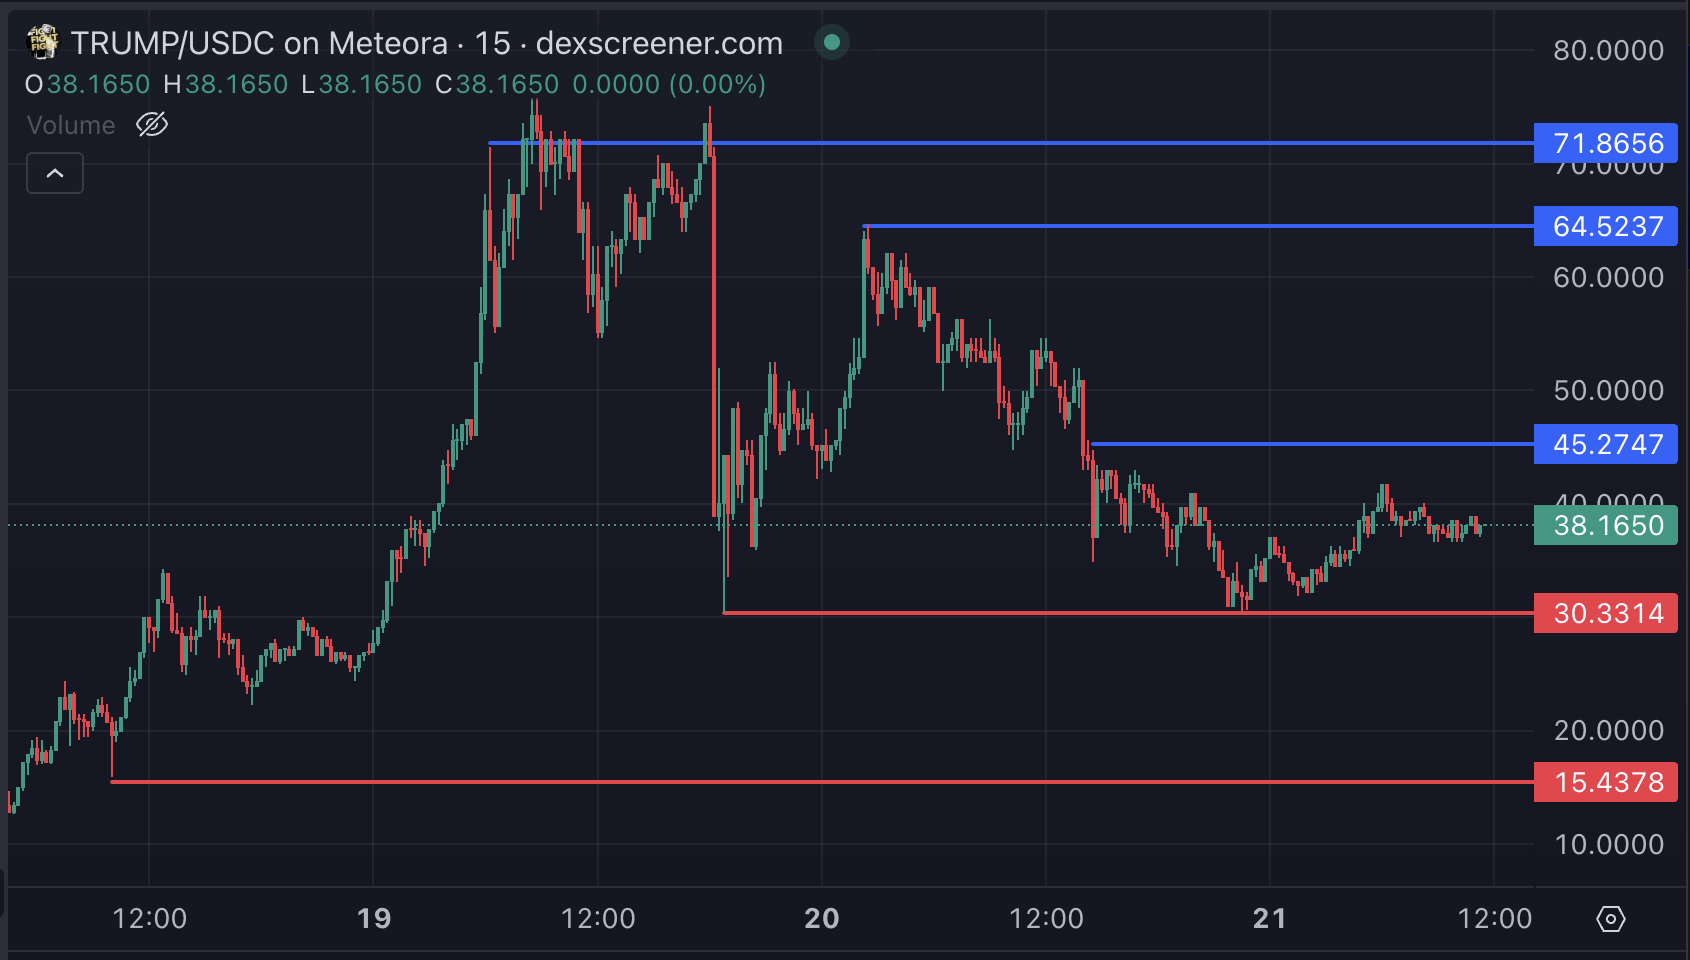
Conversely, if Trump price tests the support at $30.30 and fails to hold above it, the price could face a sharp correction. A break below this support could send the token falling to $15.43, representing a potential 59% decline.
Disclaimer
In line with Trust Project guidelines, this price analysis article is intended for informational purposes only and should not be considered financial or investment advice. BeInCrypto is committed to providing accurate and unbiased reporting, but market conditions are subject to change without notice. Always do your own research and consult a professional before making any financial decisions. Please note that our Terms and Conditions, Privacy Policy and Disclaimer have been updated.


.")