Ethereum price is trapped, but the leverage ratio indicates a bounce

Ethereum price has remained in a tight range this month as its ecosystem faces significant challenges and increasing competition.
Ethereum (ETH), the second-largest cryptocurrency, was trading at $3,310 on January 22, roughly 20% below its November highs. In comparison, Bitcoin (BTC), Solana (SOL), and Ripple (XRP) recently retested their all-time highs.
Ethereum also continued to lose market share in key areas. For example, Jito outpaced Ethereum in fee revenue this year, generating $157 million compared to Ethereum’s $112 million.
Ethereum’s decentralized exchange volume has also fallen significantly below Solana’s. Solana-based protocols such as Raydium and Orca were handled $123 billion In terms of volume over the past seven days, this compares to $26 billion worth of Ethereum. This rise was largely driven by the popularity of official Trump and Melania coins.
The price of Ethereum has also faced difficulties due to ongoing token sales by the Ethereum Foundation and rising exchange balances. According to CoinGlass, these balances have risen to 15.8 million ETH, compared to 15.3 million on January 1.
However, there are positive catalysts that point to a potential rebound in Ethereum prices. Ethereum spot ETFs saw steady inflows, reflecting some demand from Wall Street investors. Over the past five days, cumulative flows have risen to $2.74 billion.
Additionally, data shows that Ethereum’s leverage ratio has been on the rise in recent months, reaching 0.6 compared to 0.24 in September 2023. Interestingly, the leverage ratio and Ethereum’s price have diverged, which could indicate further gains. in the future.
Another promising factor is that open interest for Ethereum futures has remained high in recent weeks. On January 22, open interest reached more than $30.3 billion, a significant increase from the December low of $20 billion.
Technical analysis of Ethereum price

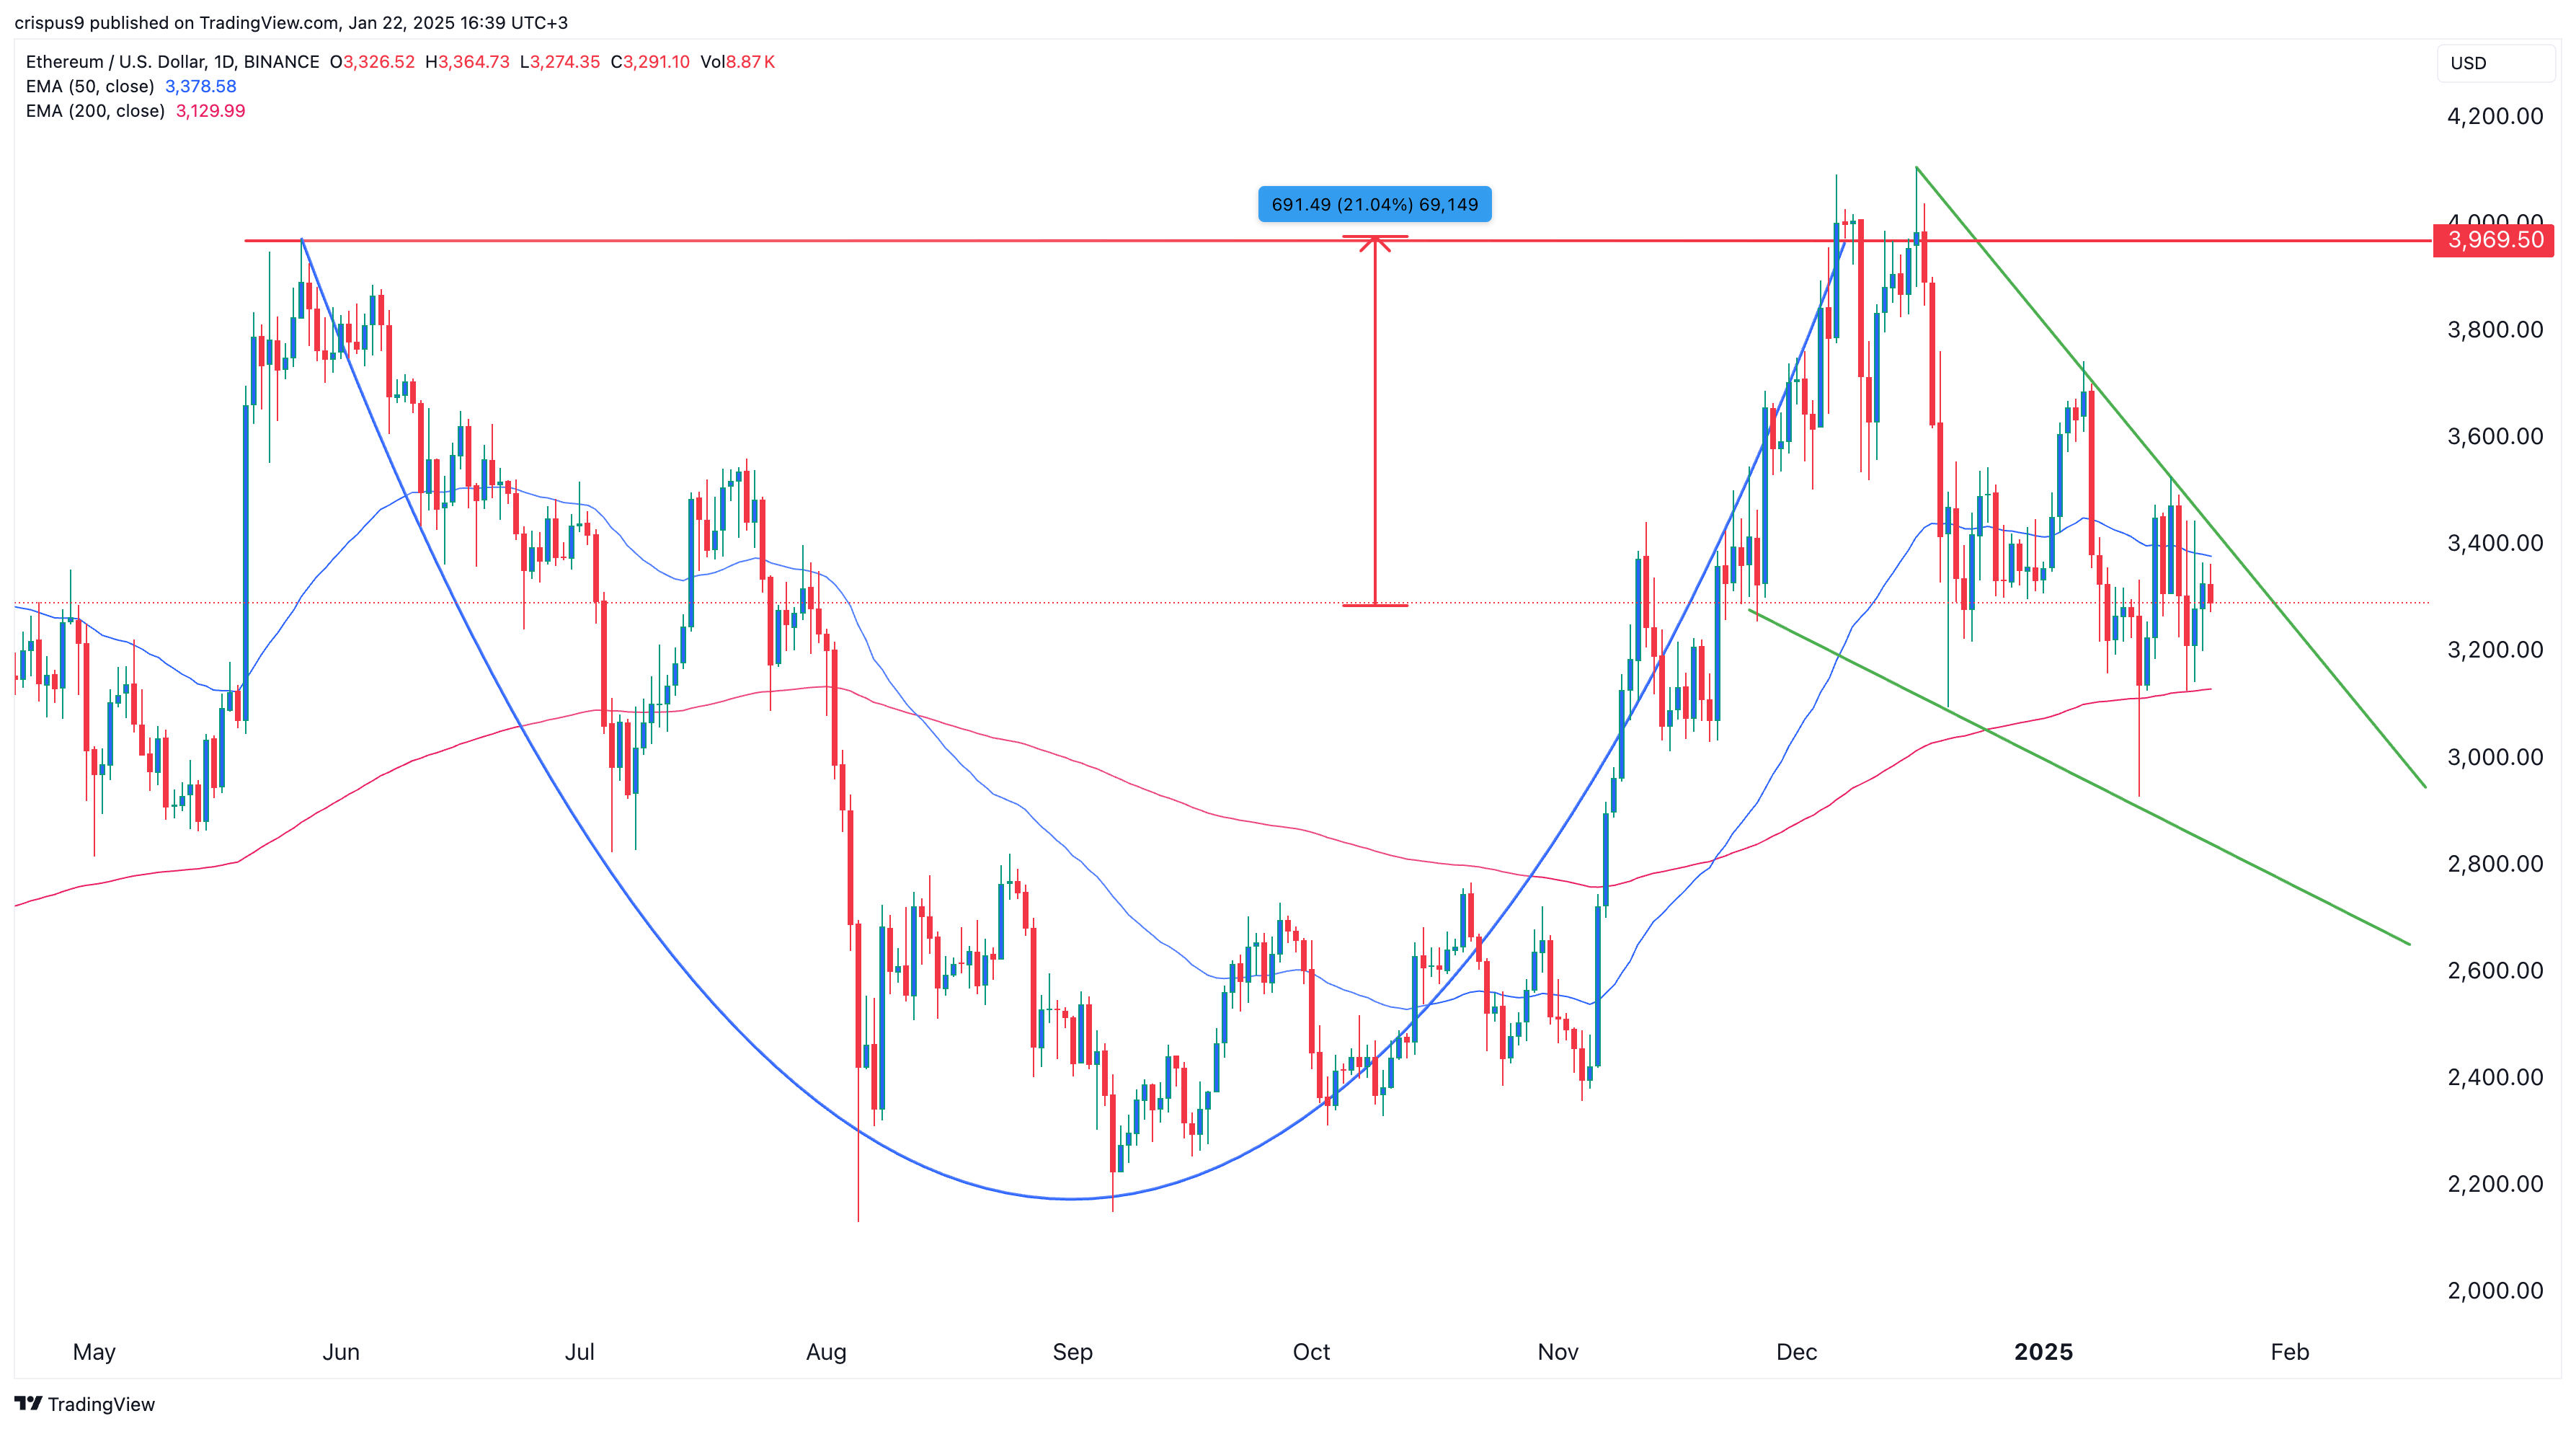
The daily chart shows that Ethereum price encountered strong resistance at $4,000, which represents the upper border of a cup and handle pattern. The cryptocurrency currently forms the handle section of this pattern.
The handle resembles a falling wedge, defined by two descending and converging trend lines. Falling wedge patterns are often bullish and indicate potential gains. Moreover, ETH remained above the 200-day EMA.
As a result, Ethereum is likely to see a strong bullish breakout, with the next target potentially at $4,000, representing a 21% increase from its current level.


